Apollo 24|7
Acquisition Project on Apollo 24|7 App
Apollo 24|7 - The Online Pharmacy
Elevator Pitch
Everyone needs access to basic healthcare.
Everyone needs medicines.
Everyone. Needs. Access. To. Pharmacies.
But NOT everyone has that access.
Have you ever had a situtation where you had to get medicines, supplements or sanitary products but had no way of going to the pharmacy?
Did you ever want these within a couple hours of ordering, delivered straight to your doorstep?
That too, from a trusted source?
Enter Apollo 247
The online pharmacy. Leveraging on their vast network of trusted Apollo pharmacies, Apollo 247 delivers all that you need from a pharmacy near you. Download NOW.

Value Proposition
Upon talking to users, the following pain points were solved.
- Going to a physical retail pharmacy is not always feasible. This can be related to lack of time, unavailanility of parking at store.
- Repetitive purchases such as sanitary pads, daily usage supplements can be easily purchased from the "Buy again" section on the home page and they get delivered to the user's doorstep.
- As the service is being provided by Apollo, it is easy for the user to trust the brand. Trust has been previously established by the hospital chain.
- Quick delivery, usually within 2 hours, adds to the reliability of the service. The items are also well packaged.
- Features such as online consultation as well as prescriptions help user get their medicines through a seamless process, all in the comfort of one's home.
- If a user requires any lab tests, the same can be schedules through the app. Blood test samples are collected form the user's home as well.
With a whopping 25.5 lakh teleconsults every year, over 1.5 Crore downloads, Apollo boasts of over 5 million weekly active users. These users come from diverse backgrounds and are parts of different demographies. The app connects people to a doctor and can deliver medicines if required all through the click of a button.
Website - https://www.apollopharmacy.in/
APP - https://play.google.com/store/apps/details?id=com.apollo.patientapp&pcampaignid=web_share
How did the user come across Apollo 247?
Early users of the app came across the service when physically visiting an Apollo pharmacy. The banners/posters in the window of every Apollo pharmacy allowed the service to grow organically and create a user base.
The real question still exists. Is Apollo 247 ready for acquisition?
Let us take a look at the flow below.

Here we can see that the customer who logs onto the app, orders various items - this could be medicines, supplements or personal care products. The items get delivered within 2 hours - AHA moment. The user brags about the service to their friends and family.
The Users
The below data shows the different user profiles obtained through user calls.
[P.S. I do not know how to make a better table in this. An image didn't work as well. My apologies for the state of it]
- The first table below shows the data obtained by asking the users about their experience with the Apollo 247 App.
Questionnaire | Information | Sujatha G. | Avinash | Sukhman | Prem | Sushmitha | Vijay | Santhoshi |
Using service for | Self/family | Self / Family | Self | Self | Self | Self/family | Self/family | |
Introduction to App | Apollo Banner in store | Apollo pharmacy banner | Ad on paper | WoM | Intro through Ads | Introduction through Ads | Pharmacy told them [WoM] | |
Repeat Customer | Repeat customer | Repeat customer | repeat customer | Repeat customer | Recurring customer | Repeat Customer | Medicines, OTC | |
Customer since | >1 yr | >1yr | >1yr | >0.5yr | >1yr | >1yr | >1yr | |
Experience Related | The WHY (Pain points solved) | User has no available mode of transport. It is convenient to order medicines and receive them in two hours | Quick delivery is the biggest factor. New baby at home doesn't allow user to always be able to go to the store | Easy and convenient way of ordering the medicines they require on a recurring basis. Quick delivery adds to the WHY. | User can't always go to the store. Door step dleivery in a couple of hours is preferred. | Convenient way of ordering and maintaining personal hygiene products without going to the store. | Convenient way of ordering and maintaining supplements without having to take the car out (parking is ALWAYS an issue) | User has no available mode of transport. It is convenient to order medicines and receive them quickly enough |
Typical purchase | Medicines | Supplements | Medication | Medicines | Sanitary Pads | Vitamins | Medicines | |
Prescription purchase | None | Yes | None | None | None | None | None | |
In app counselling | None | None | None | None | None | None | None |
Table 1: Experience Related User Data
Some Insights from Table 1:
- Users primarily bought for themselves or their families living in the same household.
- They were all repeat users - some monthly while others were once in 2-3 months.
- Personal hygiene products and supplements are ordered in a recurring manner.
- They valued time over money - willing to pay a delivery fee when applicable if it saves them a trip to the store. None of the users are subscribed to the premium "Circle" membership.
- There was a huge common value of trust associated with the name 'Apollo'.
- The second table below is the demographic data of the users interviewed.
Questionnaire | Information | Sujatha G. | Avinash | Sukhman | Prem | Sushmitha | Vijay | Santhoshi |
Age | 55-60 | 35-40 | 25-30 | 25-30 | 25-30 | 25-30 | 20-25 | |
Gender | female | Male | Female | male | Female | Male | female | |
city | Hyderabad | Mumbai | Delhi | Hyderabad | Bangalore | Vijayawada | hyderabad | |
Personal Details | Marrried | Y | Y | N | n | Y | Y | y |
Kids | One | One | N | n | N | N | no | |
Salaries | - | 40+ | 15-25L | 40L | 10-15L | 5-10L | - | |
Type of employment | Retired | COO | Marketing manager | QA engineer | Element5 - Employed | Self employed | Not working |
Table 2: Demographic Data
Some insights from Table 2:
- From retired users to younger users in thier 20s use the service as it is more convenient.
- The app is able to service in tier 1 cities as well as tier 2 cities.
- User in various stages on their careers prefer to use the service rather than go to the store.
{Time > Money}
- The third table below shows the different Apps the users use as well as where they spend time on a general basis.
Questionnaire | Information | Sujatha G. | Avinash | Sukhman | Prem | Sushmitha | Vijay | Santhoshi |
1 | Insta | |||||||
2 | Youtube | Youtube | Twitter / X | Movies | ||||
Frequently Used Apps & Time Spent | 3 | Twitter / X | Chess | Spotify | Netflix | Youtube | Netflix | |
4 | Amazon | Walking | Reading | Twitter / X | Audiobooks | Walking | Art | |
5 | Investment portfolio | - | Working Out | Cred | - | - | Time with family |
Table 3: Apps & Time Spent
Some insights from Table 3:
- While the usage reason may vary, all users are avid users of social media.
- When not on social media, the users tends to go out instead of staying at home.
- The final table below shows the different spending patterns of the users.
Questionnaire | Information | Sujatha G. | Avinash | Sukhman | Prem | Sushmitha | Vijay | Santhoshi |
1 | Shopping - Groceries | Eating out / Ordering In | Eating out / Ordering In | Eating out / Ordering In | Eating out / Ordering In | Eating out / Ordering In | Eating out / Ordering In | |
Spending Pattern | 2 | Medicines | Investments | Shopping - Groceries | Movies | Shopping - Groceries | Shopping - Groceries | Shopping - Clothes |
3 | Cabs | Shopping - Apparel | Socialising | Concerts | Cosmetics & personal care | Shopping - Amazon | - | |
4 | Investments | Rent | - | - | Blinkist | - | - |
Table 4: Spending Patterns of the Users
Some insights from Table 4:
- Most users' top spend is eating out or ordering in food.
- The second in the list is groceries and home related expenses.
- For the older users, medicines take a higher place in spending pattern.
- Shopping for apparel in person or shopping online on amazon is another major spending category.
ICPs
Based on the user interviews conducted, below are two of the ICPs selected -
- The ones who've Retired
- Aged above 55, where no one in the house has a full time job - retired from work.
- They earn from passive income by investing in stocks and with their planned retirement annuity payment.
- Their typical purchase is medicines and vitamin supplements.
- Money is not a huge factor when it comes to making financial decisions - they are careful with money but value time over money.
- It is not easy for them to go out for medicines on a regular basis. At this age, we can make the assumption that they require medication on a recurring basis.
- They spend their time with any avocation they've taken up post retirement, watch TV (mainly news) and get insights on stocks from Twitter and instagram.
- AOV is on the higher side - higher than the overall average AOV of Rs. 400.
- The ones who've just settled down
- Aged between 25-35, these users are either just married or have just had a kid.
- They work fulltime jobs with salaries typically between 15-25 LPA.
- The typical purchase for this ICP is medicines, supplements as well as personal care items. This builds a recurring purchase pattern. For e.g. one user purchases sanitary pads on a recurring basis from the app.
- These users value time over money. The scenario of ordering products and finidng them at the doorstep when they come back from office is very enticing. Stopping at a medical store on the way from office, especially if travelling by cab is not feasible. Convenience of delivery trumps all.
- They spend their free time on social media, mainly instagram, but also by going out. Maximum expenditure of this ICP is in the food delivery / eating out category. It is important for them to find the "Work-life Balance".
- AOV of this category is about the same as the average AOV of Rs. 400.
TAM
Before we look at the data to calculate TAM, we have to keep in mind that Apollo 247 is an online service. We look at the number of people with access to internet. We also look at Tier 1 & tier 2 cities where Apollo 247 has a vast network. While some tier 3 cities have Apollo pharmacies, the 247 delivery service is not yet as available.
In order to calculate TAM, the Top Down Approach will be taken. This is to see that out of the total population of the country, how many people Apollo 247 can serve. Taking into account different factors like access to internet and availability of Apollo 247 in different parts of the country, The TAM is calculated below.
The interest over time for 'Apollo Pharmacy Near Me' has an average of 79% as per google trends.
Link - https://trends.google.com/trends/explore?geo=IN&q=apollo%20pharmacy%20near%20me
Top Down Approach
Criteria | Share | Absolutes | Source |
|---|---|---|---|
Total Population (2023) | 100% | 143 Cr | https://www.worldometers.info/world-population/india-population/#:~:text=India%202023%20population%20is%20estimated,of%20the%20total%20world%20population. |
People with access to internet | 61.6% | 88.1 Cr | https://www.thehindubusinessline.com/info-tech/indias-internet-subscribers-increased-to-88125-million-as-of-march-end-trai-report/article67219636.ece#:~:text=Total%20number%20of%20Internet%20subscribers,January%E2%80%93March%202023%20on%20Monday. |
Urban Population with internet | 25.2% | 36 Cr | https://www.thehindu.com/news/national/over-50-indians-are-active-internet-users-now-base-to-reach-900-million-by-2025-report/article66809522.ece#:~:text=According%20to%20the%20report%2C%20out,the%20internet%20in%20the%20country. |
Tier 1 & Tier 2 cities | 15.4% | 22 Cr | |
Internet penetration in Tier1 & tier 2 cities | 74% of 22 Cr | 16.28 Cr | |
Population between 25-35 (Chosen ICP) | 27% of 16.28 Cr | 4.39 Cr |
Table 5: Data to calculate TAM
TAM = The population in Tier 1 & Tier 2 cities in India with access to internet.
Hence, TAM = 16.28 Cr.
SAM = Population between 25-35 in Tier 1 & Tier 2 Cities (base don ICP selected)
Hence, SAM = 4.39 Cr
SOM = Obtainable percentage of SAM.
According to a 2021 article (link below), Apollo's epharmacy was expected to have 14% market share.
SOM = 14% of 4.39 Cr
SOM = 61.1 Lakh.
Channel Selection
In order to scale a product that is in early scaling stage, where the mobile APP is the main focus, the following criteria must be met.
- Lead time to acquire users must be low
- Flexibility of the channel must be high
- Effort must be low
- Scale / reach must be high
 Table 6: Channel Aquisition Framework
Based on the above table, we can see that the two favourable channels to scale the product are referrals and paid Ads (Google & Facebook).
Channel 1 - Referral Program
The backbone of a referral program is the brag-worthiness of the product. The user, who reveives their items within 2 hours, in a proper manner, without spillages or expired items, is validated using a rating. If the user gives a 5 star rating, the user will be asked if they would like to refer the app to a anyone. But what will the user get from this?
Health Credits (HC) - 1 HC = Re. 1
Apollo has an in-app currency of health credits. These health credits are accrued when the user visits an Apollo health center for checkup (1.5% of bill balue), 5% of non-pharmaceutical products and 10% of pharmaceutical products bought from the pharmacy or play quizzes in APP to earn HCs.
The referral program can be discovered by the user through the app. They will also be notified wih banner notifications as well and SMS & whatsapp notifications if they are eligible to refer.


On every successful referral, the user who refers (henceforth called as the referee), get a 100 HCs credited to their in-app wallet. These HCs can only be spent on orders valuing more than Rs. 199.
On the other hand, the user receiving the referral (henceforth known as the referral), gets 100 HCs credited to their in-app wallet for their first purchase. However, the minimum order value must be over Rs. 199 for this to apply.
In both cases, delivery charges are applied the same as before - waived off if the order value is above Rs. 500.
Tracking System for Referrals

Apollo 247 does not currently have a referral program. The below image shows three screens that coulbe be the referral flow of the app. User goes into their account page by clicking on their icon in the top right part of the screen. Here they will find a list of options about their previous orders, lab test and health records. The wallet option contains the spends of the user and their credits accrued in the process.
Eligible users will find that on clicking "wallet", they will be taken into a page where the top half will show their ledger for HCs and the bottom half will show their referrals. Here, along with people they've already referred and the status of their referrals, an "Add New" button allows them to refer more users.
On clicking on a particular referral, the user is taken to another page where the details of the referral are seen.
Average Referrals Per Person
In order to increase the average referrals per person, the user is given a milestone. The last stage of this mountainous milestone is 50 referrals where the user become a Circle member for life. They can avail discounts on orders and consultations as well as enjoy no delivery charges on any orders. On average, a Circle member saves utpo 848 rupees per month.
Smaller milestones:
On reaching 20 referrals, the referee gets 1000 HCs bonus and one month of Circle membership free.
On reaching 30 referrals, the referee gets 1500 HCs bonus and 3 months of Circle mebership free.
On reaching 40 referrals, the referee gets 2000 HCs bonus and 6 months of Circle mebership free.
Channel 2 - Paid Ads
In order to ensure that paid Ad channels are the way to go, the CAC:LTV ratio needs to be determined.
Based on 2019 data found in the below link 1, the average order value for an indian epharmacy is Rs. 1200. Average monthly transaction as per link 2 is 1.3x. The retention is assumed as 6 months. Hence the LTV is:
1200 x 1.3 x 6 = Rs. 9360
The CAC for online ecommerce companies is Rs. 1500 at max (as per link 3).
Therefore the CAC : LTV ratio = 1 : 6.24
Hence Paid ad channels are suitable.
Link 3 - https://www.gokwik.co/blog/reduce-customer-acquisition-cost/#:~:text=Meanwhile%2C%20most%20Indian%20eCommerce%20sites,cost%20of%20acquiring%20new%20customers.
From Table 6, the channel selection framework, Instagram ads and Google Ads are the two main channels to be focussed on. With large scale potential, low led time, low effort and high flexibility, these two channels, despite the higher cost, can help scale the product. it is to be noted that the product is assumed to be in early scaling stage.
Google Ads
Google has many different types of AD formats. Some of which are given below.
- Text ads - These are ads that are usually seen in google search. With the tag "sponsored" the link is shown. This type of AD can be displayed when keywords are searched on Google.

- Image ads - Ads shown on the side of youtube above the video that is to be played next. Clicking on it will route the user to the play store.

- Video ads - Ads which can be before a video on Youtube or inside another app that has enabled ads to be shown. The latter is related to Ap Promotion ads where the CTA takes the user directly to the app store to donload the app.
Here is a link to a video AD that played on Youtube, wither before, in the middle of or after videos.
Link - https://youtu.be/Z2t2Qla0scc?si=kwRf5PFevVqFzB51
Below is an image portraying the call to action after a video AD has played in an app.
Instagram Ads
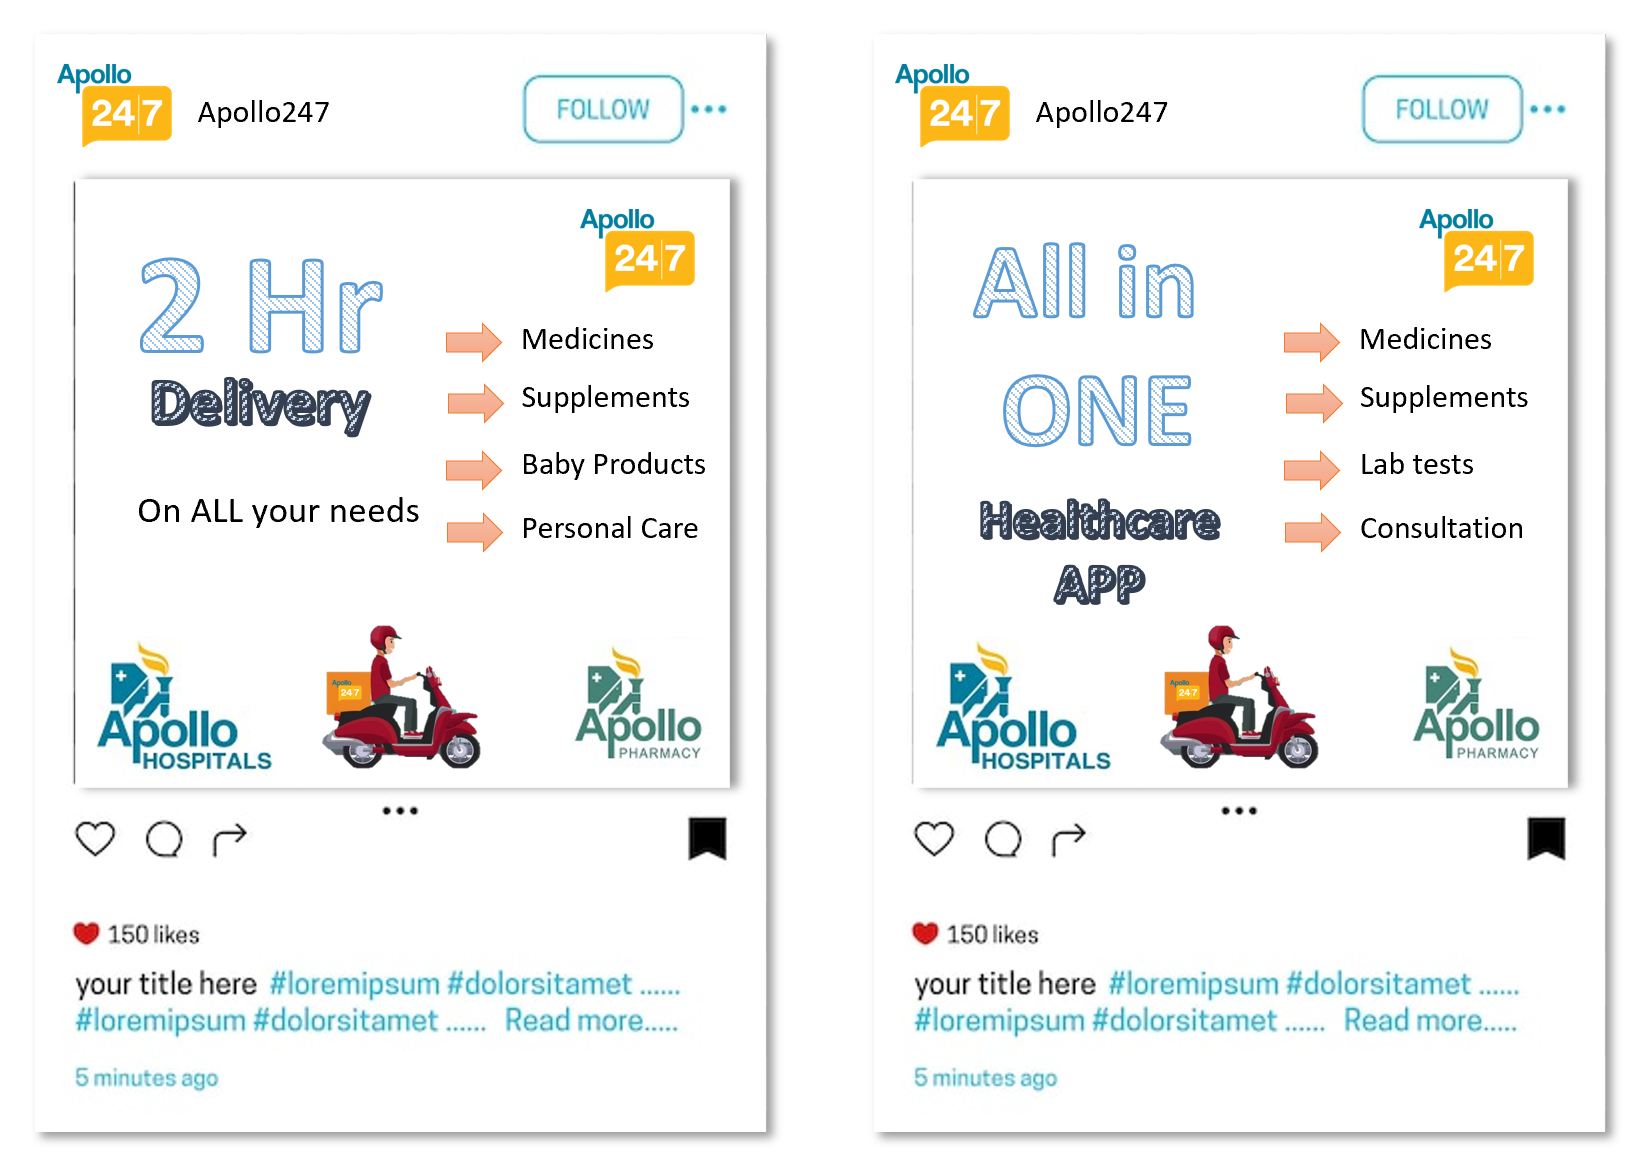
The best way to feature the service of Apollo 247 is through sponsored posts. While scrolling through their feed, a user will come across the ad for the service, which when clicked, will take them to the play store to download. This ad must be placed based on the ICP and understand which pain point to tackle.
The ICP between age 25-35 would be targeted with quick delivery and easy access to basic personal care products and supplements. (right side AD below)
The ICP above age 55 would be targeted with quick delivery of medicines and supplements but also lab tests, online doctor consultations as they are less likely to be able to go out. (left side AD below)
Both ICPs will be targeted with trust of Apollo as that is a major factor for conversion.
The Budget
There are twi factors when looking a the budget for paid ads. The cost per click (CPC) and the Cost per thousand Impressions (CPM).
Google Ads
- Search Ads - CPC = Rs. 20 | CPM = Rs. 50
With a budget of Rs. 20,000, we can reach around 300,000 people. A 0.57% conversion rate (link below) is 1700 users. If another 5% order from the app, with an average spend of Rs. 1200 and gross margin of 30%, we get around Rs. 30k.
.
Link - https://megadigital.ai/en/blog/search-ads-vs-display-ads/#:~:text=Average%20CVR%20For%20Search%20campaigns%2C%20the%20average,rate%20is%20significantly%20lower%20at%20only%200.57%. - Image Ads - CPC = Rs. 5 | CPM = Rs. 50
With a budget of Rs. 20,000, we can reach around 300,000 people. A 0.59% conversion rate (link below) is 1700 users. If another 5% order from the app, with an average spend of Rs. 1200 and gross margin of 30%, we get around 32k
Instagram Ads
- CPC = Rs. 7.5 | CPM = Rs. 150
With a budget of Rs. 40,000 we can reach an average of 200,000 people. A 1.08% conversion rate (see link below) is 2000 users. If another 5% order from the app, and we take AOV of Rs. 1,200 and gross margin of 30%, we get a return of around Rs. 36,000.
Link - https://beprofit.co/a/community/business-metrics/how-to-calculate-the-average-conversion-rate-on-instagram
For the reach that instagram has, the return is not enough. However, the numbers can be scaled based on the correct conversion rates and applied.
Ad Spend
From Google search Ads, we can definitely send Rs. 20,000 per day and scale the product.
Instagram Ads have to be more cricitally seen as the return may not be more than the Ad spend.
Brand focused courses
Great brands aren't built on clicks. They're built on trust. Craft narratives that resonate, campaigns that stand out, and brands that last.


All courses
Master every lever of growth — from acquisition to retention, data to events. Pick a course, go deep, and apply it to your business right away.


Explore courses by GrowthX
Built by Leaders From Amazon, CRED, Zepto, Hindustan Unilever, Flipkart, paytm & more
Course
Advanced Growth Strategy
Core principles to distribution, user onboarding, retention & monetisation.
58 modules
21 hours
Course
Go to Market
Learn to implement lean, balanced & all out GTM strategies while getting stakeholder buy-in.
17 modules
1 hour
Course
Brand Led Growth
Design your brand wedge & implement it across every customer touchpoint.
15 modules
2 hours
Course
Event Led Growth
Design an end to end strategy to create events that drive revenue growth.
48 modules
1 hour
Course
Growth Model Design
Learn how to break down your North Star metric into actionable input levers and prioritise them.
9 modules
1 hour
Course
Building Growth Teams
Learn how to design your team blueprint, attract, hire & retain great talent
24 modules
1 hour
Course
Data Led Growth
Learn the science of RCA & experimentation design to drive real revenue impact.
12 modules
2 hours
Course
Email marketing
Learn how to set up email as a channel and build the 0 → 1 strategy for email marketing
12 modules
1 hour
Course
Partnership Led Growth
Design product integrations & channel partnerships to drive revenue impact.
27 modules
1 hour
Course
Tech for Growth
Learn to ship better products with engineering & take informed trade-offs.
14 modules
2 hours
Crack a new job or a promotion with ELEVATE
Designed for mid-senior & leadership roles across growth, product, marketing, strategy & business


Learning Resources
Browse 500+ case studies, articles & resources the learning resources that you won't find on the internet.

Patience—you’re about to be impressed.